How to Read NVMe SMART Data
Your SSD’s health bar says 91% and you have no idea if that’s fine or a five alarm fire. That’s the problem with most SMART monitoring tools: they hand you a single number and expect you to trust it, without explaining what’s actually being measured underneath. If you want to know whether your NVMe drive is genuinely at risk or just aging normally, you need to look past the summary percentage and into the actual attribute data.
What NVMe SMART Data Actually Tells You
NVMe drives report health through a standardized log page instead of the older ATA SMART attribute table that spinning hard drives and SATA SSDs use. This is technically called the SMART/Health Information Log, and it’s built into the NVMe spec itself, which is part of why NVMe drives tend to give more consistent readings across different brands than SATA SSDs do.
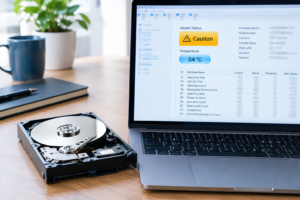
Tools like CrystalDiskInfo, Samsung Magician, and the open source smartctl utility all pull from this same log, but they don’t always display or weight the fields identically. That’s why two tools can show the same drive with slightly different health percentages. Neither one is wrong, they’re just calculating differently.
The Fields That Actually Matter

Skip the summary score for a minute and look at these individual fields instead. They tell you far more than any single percentage.
- Critical Warning: This should read 0. Any nonzero value means the drive is flagging a real problem, such as low spare capacity, high temperature, or degraded media.
- Available Spare: NVMe drives reserve extra flash blocks to replace ones that wear out. This field shows what percentage of that reserve is left. It should stay near 100% for most of a drive’s life.
- Percentage Used: This is the number most tools rebrand as “health.” It’s an endurance estimate based on how much of the manufacturer’s rated write endurance you’ve consumed, not a measure of current damage.
- Media and Data Integrity Errors: This counts actual uncorrectable errors. It should be zero. If it’s climbing, that’s a real sign of failing NAND.
- Unsafe Shutdowns: A high count here (from crashes, power loss, or yanking the drive without ejecting) can correlate with corruption risk, especially on drives without power loss protection.
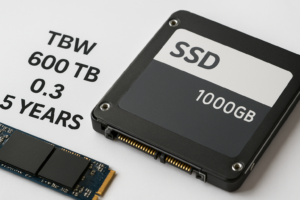
- Data Units Written: This tells you total lifetime writes, useful for comparing against your drive’s rated TBW (terabytes written) endurance figure.
- Temperature: NVMe drives throttle and can even shut down if they overheat. Sustained readings above 70°C are worth investigating, especially in laptops with poor thermal design.
If you’re trying to decide between drive types before a purchase rather than diagnosing one you already own, our breakdown of what NVMe SSDs are actually used for covers where the performance and endurance tradeoffs come from in the first place.
What That “Health Percentage” Really Means

Here’s what trips people up: the health percentage shown by most tools is not a prediction of imminent failure. It’s almost always derived from the Percentage Used field, which is an endurance countdown based on write volume compared to the manufacturer’s TBW rating.
A drive rated for 300 TBW that has written 150TB of data will show roughly 50% used, and therefore roughly 50% “health.” That doesn’t mean the drive is halfway to dying. Plenty of SSDs keep working well past their rated TBW, because manufacturers build in conservative estimates with margin to spare.
The flip side matters too. A drive can show 99% health and still fail suddenly due to a controller defect, firmware bug, or a bad batch of NAND. Endurance wear and outright failure are two different risks, and the single percentage number conflates them. That’s exactly why you check Critical Warning and Media Integrity Errors alongside it instead of relying on one figure alone.
Normal Readings vs Warning Signs

A drive in good shape typically looks like this: Available Spare near 100%, Critical Warning at 0, zero media errors, and a Percentage Used that climbs slowly and predictably over months or years of normal use. Temperatures that spike under heavy load but settle back down during idle are also normal, that’s the drive doing its job.
Treat these as signs it’s time to back up immediately and start planning a replacement:
- Critical Warning reporting anything other than 0
- Available Spare dropping below 10-20%, or falling quickly over a short period
- Media and Data Integrity Errors increasing at all, even slowly
- Sudden jumps in Percentage Used that don’t match your actual usage pattern
- The drive disappearing from the system, taking longer to boot, or throwing read/write errors in the OS
None of these guarantee failure is imminent, but they mean the odds have shifted enough that you shouldn’t be gambling with data you care about. If your laptop’s SSD is central to your daily workflow, it’s also worth reading up on how much your SSD actually affects everyday performance, since a degrading drive doesn’t just risk data loss, it also slows everything down first.
Manufacturer Tools and Their Quirks
Generic tools like CrystalDiskInfo read raw SMART log data, but manufacturer software often applies its own health algorithm on top. Samsung Magician, for example, factors in additional internal metrics beyond simple Percentage Used, and it’s generally considered one of the more accurate first party tools available.
WD’s dashboard and Crucial’s Storage Executive do something similar but weight things slightly differently, which is one more reason two different tools checking the same drive can disagree on a health score by a few percentage points. Neither reading is necessarily wrong, they’re just built on different formulas.
If you’re running a Samsung NVMe drive, keeping firmware current also matters for accurate reporting, since older firmware versions have occasionally misreported wear leveling data. Our guide on updating Samsung SSD firmware walks through that process safely. And if you’re comparing NVMe against older Intel SSD models for a system upgrade, our NVMe vs Intel SSD comparison covers how their monitoring and endurance reporting differ too.
For command line users, smartctl (part of the smartmontools package) gives you the rawest and most tool independent view of NVMe log data. It’s the option to reach for if you want the numbers without any vendor interpretation layered on top.
Frequently Asked Questions
Is 80% SSD health still safe to use?
In most cases, yes. Remember that this number usually reflects Percentage Used against the rated endurance, not actual damage. As long as Critical Warning stays at 0 and Media Integrity Errors stay at 0, an 80% reading just means the drive has consumed some of its rated write budget, not that failure is near. Keep an eye on the trend rather than panicking over the number itself.
Why do different SMART tools show different health percentages for the same drive?
Each tool applies its own formula to the raw NVMe log data. Some weight Available Spare more heavily, others rely almost entirely on Percentage Used, and manufacturer tools sometimes factor in proprietary internal metrics. Check the underlying attributes (Critical Warning, Available Spare, error counts) rather than trusting any single summary score as definitive.
Can a drive fail even with good SMART numbers?
Yes. SMART data tracks wear and known error conditions, but it can’t predict a sudden controller failure, a firmware crash, or physical damage from power surges. Good SMART readings lower your risk considerably, but they’re not a guarantee. That’s why regular backups matter regardless of what the health percentage says.

James Kennedy is a writer and product researcher at Drives Hero with a background in IT administration and consulting. He has hands-on experience with storage, networking, and system performance, and regularly improves and optimizes his home networking setup.