MB/s vs Mbps vs Gbps Conversion Chart
You’ve seen the numbers on product boxes and speed test results: 940 Mbps internet, 550 MB/s SSD, 10 Gbps USB port. They look similar, but mixing them up leads to some confusing math, like assuming a “1 Gbps” network connection will transfer files at 1 GB per second (it won’t, not even close). This chart clears up the difference between bits and bytes, and shows you what these interfaces actually deliver once real-world overhead is factored in.
The Core Conversion: Bits vs Bytes

Networking gear (Ethernet, Wi-Fi, cellular) is almost always measured in bits per second: Mbps and Gbps. Storage devices (SSDs, hard drives, USB drives) are measured in bytes per second: MB/s and GB/s. There are 8 bits in a byte, so the conversion is simple math, but it trips people up constantly.
- Mbps to MB/s: divide by 8
- Gbps to MB/s: multiply by 125
- MB/s to Mbps: multiply by 8
So a 1 Gbps network connection tops out at a theoretical 125 MB/s, not 1,000 MB/s. That single mix-up explains most of the “why is my gigabit internet only hitting 100 MB/s” confusion you’ll find online.
Network Speed Conversion Chart

These are theoretical ceilings based on the interface spec, followed by what you’ll typically see in practice once protocol overhead, network congestion, and hardware limits are accounted for.
| Interface / Speed | Theoretical MB/s | Realistic MB/s |
|---|---|---|
| 100 Mbps Ethernet | 12.5 MB/s | ~10-11 MB/s |
| 1 Gbps Ethernet | 125 MB/s | ~110-118 MB/s |
| 2.5 Gbps Ethernet | 312.5 MB/s | ~270-300 MB/s |
| 5 Gbps Ethernet | 625 MB/s | ~500-550 MB/s |
| 10 Gbps Ethernet | 1,250 MB/s | ~1,000-1,180 MB/s |
| Wi-Fi 6 (2,402 Mbps link) | ~300 MB/s | ~100-150 MB/s |
Wi-Fi looks great on paper but rarely gets close to its theoretical number because of signal interference, shared airtime with other devices, and distance from the router.
Storage Interface Conversion Chart
This is where things get more relevant for anyone shopping for an SSD or trying to figure out why an “8 Gbps” drive doesn’t hit 1 GB/s. Storage interfaces get closer to their theoretical max than Wi-Fi does, but there’s still a gap caused by encoding overhead and controller limits.
| Interface | Theoretical MB/s | Realistic MB/s |
|---|---|---|
| SATA III (6 Gbps) | 750 MB/s | ~550-560 MB/s |
| USB 3.2 Gen 1 (5 Gbps) | 625 MB/s | ~400-450 MB/s |
| USB 3.2 Gen 2 (10 Gbps) | 1,250 MB/s | ~900-1,000 MB/s |
| Thunderbolt 3 / USB4 (40 Gbps) | 5,000 MB/s | ~2,800-3,000 MB/s |
| PCIe 3.0 x4 NVMe | ~3,940 MB/s | ~3,400-3,500 MB/s |
| PCIe 4.0 x4 NVMe | ~7,880 MB/s | ~6,800-7,400 MB/s |
| PCIe 5.0 x4 NVMe | ~15,760 MB/s | ~10,000-14,000 MB/s |
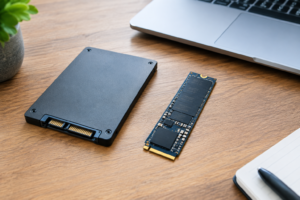
Notice how SATA III falls well short of its 750 MB/s ceiling, while NVMe drives get much closer to their theoretical numbers. That gap is a big part of why SATA and NVMe SSDs perform so differently in gaming and everyday use, even when the marketing numbers seem close on paper.
Why Real-World Speeds Fall Short of the Spec Sheet

SATA uses an older 8b/10b encoding scheme that burns 20% of raw bandwidth just on overhead, which is the main reason a 6 Gbps SATA link never actually delivers 750 MB/s. PCIe uses a more efficient 128b/130b encoding (roughly 1.5% overhead), which is a big part of why NVMe drives get so much closer to their advertised speeds than SATA drives do.
Beyond encoding, you’re also dealing with controller limits, thermal throttling on cheaper drives, file system overhead, and whatever else is sharing that connection. This is why two drives rated for the same PCIe generation can post noticeably different real-world numbers, as seen when comparing drives like the WD Black SN770 against the SN850X.
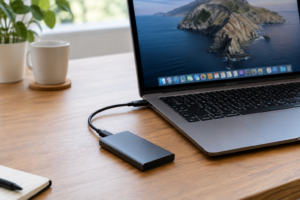
External drives add another layer of overhead. A Thunderbolt or USB4 enclosure rated at 40 Gbps sounds like it should outrun any NVMe drive, but the actual bottleneck is usually the NVMe controller inside the enclosure, not the cable. That’s worth keeping in mind if you’re wondering whether an external SSD will actually speed up your laptop or just move the bottleneck somewhere else.
Frequently Asked Questions
Why does my “1 Gbps” internet plan only show 100-120 MB/s in speed tests?
Because internet plans are sold in bits, not bytes. A 1 Gbps connection has a theoretical ceiling of 125 MB/s, and real-world overhead from your router, Wi-Fi signal, and the speed test server itself typically brings that down to 100-118 MB/s. That’s completely normal and not a sign anything is wrong with your connection.
Is a 10 Gbps USB port faster than a SATA SSD?
On paper yes, since 10 Gbps USB (1,250 MB/s theoretical) outpaces SATA III’s 750 MB/s ceiling. In practice, a 10 Gbps USB 3.2 Gen 2 connection to a good external SSD can hit around 900-1,000 MB/s, well above the roughly 550 MB/s you’ll get from an internal SATA drive. If you’re deciding between drive types for a laptop upgrade, it’s also worth reading up on how much SSD choice actually affects everyday laptop performance before you buy.

James Kennedy is a writer and product researcher at Drives Hero with a background in IT administration and consulting. He has hands-on experience with storage, networking, and system performance, and regularly improves and optimizes his home networking setup.