What Does 99% SSD Health Mean?
You check your SSD health and see 99%. Your first reaction is probably relief, followed almost immediately by a nagging question: what happened to that missing 1%, and should you be worried about it? The truth is that number tells you a lot less than most disk utilities want you to believe, and treating it as a countdown to failure will either cause needless panic or, worse, blind you to the warning signs that actually matter.
This guide breaks down what that percentage is built from, which SMART and NVMe attributes you should actually be watching, and when a reading justifies backing up your data or planning a replacement.
What the Health Percentage Actually Measures
SSD health percentages aren’t a direct readout of “how much life is left” in any meaningful physical sense. They’re a calculated estimate, usually derived from SMART attributes on SATA drives or NVMe log data, that tries to translate wear indicators into something simple enough for a progress bar.
The core input for most drives is NAND wear. Every SSD is built from flash memory cells rated for a limited number of program/erase cycles. Once you’ve used up a percentage of those cycles, the tool subtracts that from 100 and shows you the remainder. So 99% typically means you’ve consumed roughly 1% of the drive’s rated write endurance, not that the drive is one bad day from dying.
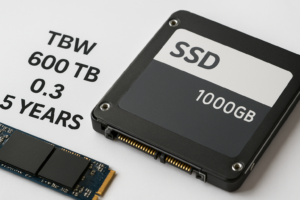
That distinction matters because endurance is measured in total bytes written, often expressed as TBW (terabytes written), and consumer SSDs are rated for staggering amounts of that. A typical 1TB consumer drive might carry a TBW rating of 600 or higher. Getting to 99% almost always just means you’ve barely scratched the surface of a very large number.
The SMART and NVMe Attributes That Actually Matter
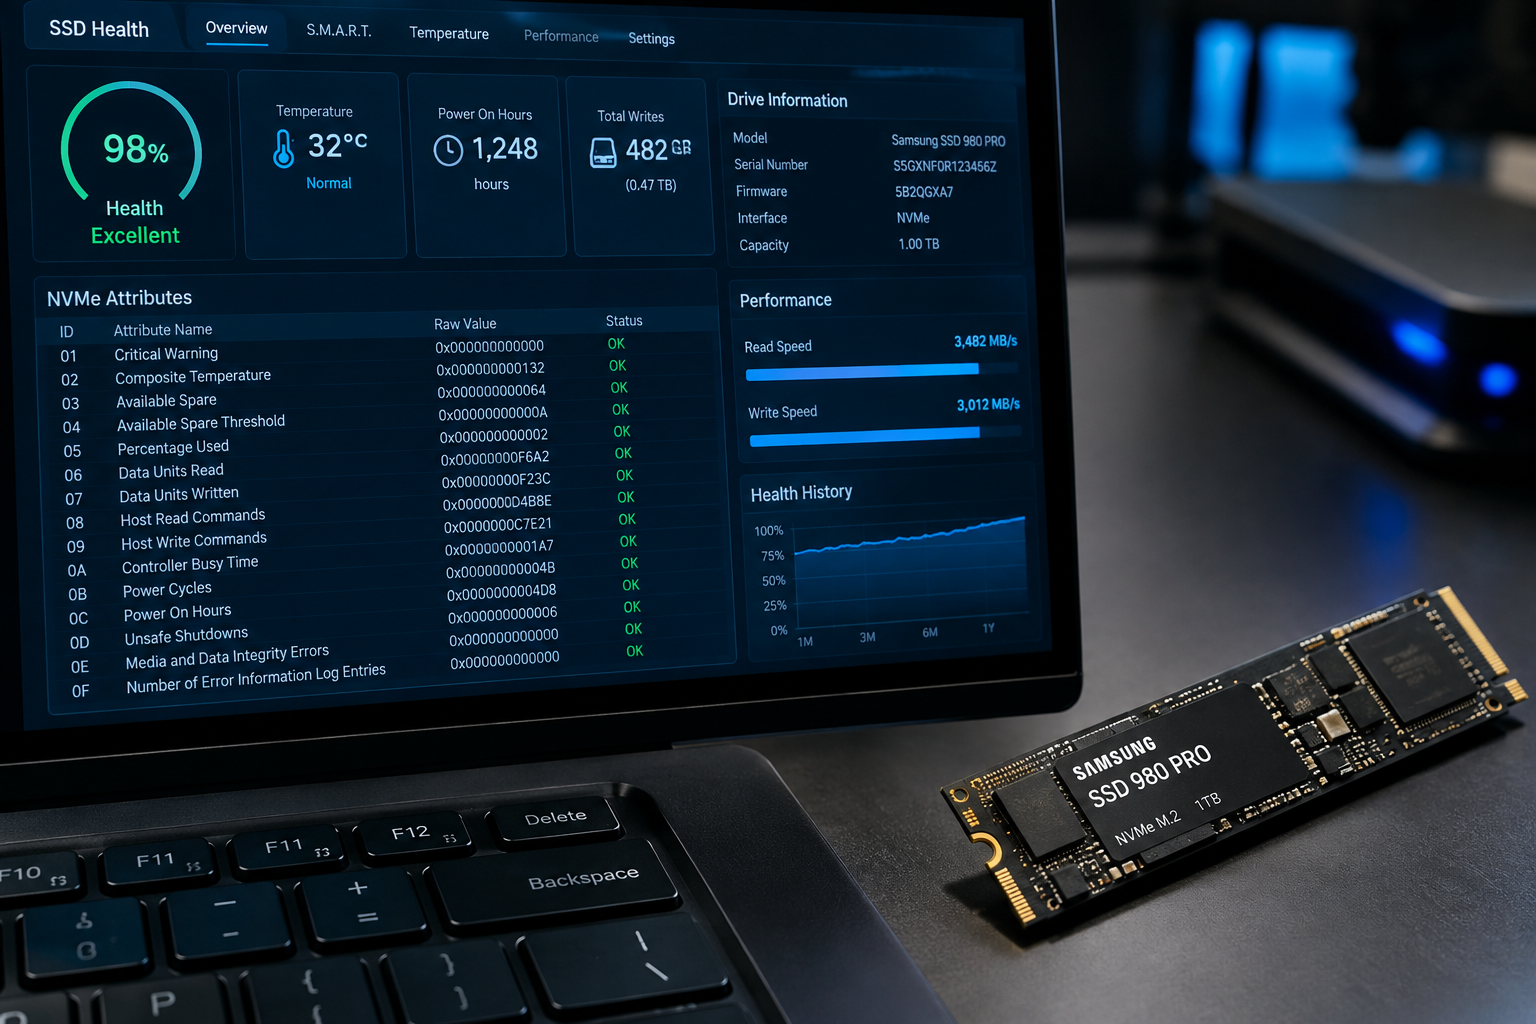
If you want a real read on drive condition, the single percentage number is the least useful part of the report. The attributes underneath it tell the real story.
- Percentage Used (NVMe attribute 0xEC / “Percentage Used”): This is what most health tools report directly. It’s a vendor-normalized estimate based on wear leveling and program/erase cycle counts.
- Reallocated Sector Count (SMART ID 05): On SATA SSDs, this tracks cells that have failed and been swapped for spares. A rising number here is more concerning than a slowly dropping health percentage.
- Media and Data Integrity Errors (NVMe): This flags actual data corruption events, which is a far more urgent signal than wear percentage.
- Available Spare (NVMe attribute 0xAA): This shows what percentage of spare blocks remain for the drive to use as replacements. When this drops below the drive’s threshold, most firmware triggers a warning independent of the general health score.
- Power-On Hours and Power Cycle Count: These give you context. A drive with 40,000 power-on hours at 99% health is aging very differently than one with 200 hours at the same reading.
- Unsafe Shutdowns: Frequent unclean shutdowns can stress the drive’s controller and cache, and a high count alongside dropping health is worth noting.
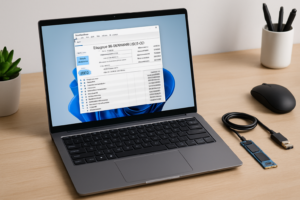
Tools like CrystalDiskInfo, Samsung Magician, and Western Digital Dashboard all pull from these fields, but they don’t always display the raw numbers by default. If your drive supports NVMe, switching the tool’s view to raw SMART/NVMe data instead of the summary tab gives you a much clearer picture than the percentage alone.
Is 99% Normal or a Cause for Concern?
For almost every user, 99% is completely normal, especially on a drive that’s been in use for anywhere from a few weeks to a couple of years. It simply reflects light to moderate write activity relative to the drive’s total rated endurance.
Where it becomes worth a second look is the rate of change, not the number itself. A drive that dropped from 100% to 99% over three years of normal use is aging exactly as expected. A drive that dropped from 100% to 99% in a single month, especially without heavy workloads like video editing, virtual machines, or constant large file transfers, is burning through endurance faster than it should.
If you’re not sure whether your workload is unusually write-heavy, think about what’s actually happening on the drive daily. Browser cache, temp files, page file activity, and background syncing from cloud services all generate writes you don’t see. None of that is a problem on its own, but it explains why health can tick down even on a machine that “isn’t doing much.”
Manufacturer Calculations Aren’t Standardized
One thing that trips people up is comparing health percentages across different brands as if they mean the same thing. They don’t.
Samsung Magician, for example, weighs wear leveling count and total bytes written against the drive’s TBW rating, and can produce different results than a third-party tool reading the same raw SMART data. Western Digital and Crucial drives calculate their own thresholds for “Available Spare” and end-of-life warnings, which don’t line up one-to-one with Samsung’s model. Even within a single brand, an NVMe drive and a SATA drive from the same manufacturer can use different attribute sets entirely, since NVMe defines its own health log separate from the legacy SMART standard.
This is part of why comparing a WD Black SN770 and a WD Black SN850X side by side can show different health reporting behavior even under similar workloads, since firmware and controller generation both affect how wear gets logged and reported.
Practically, this means you shouldn’t panic if switching monitoring tools shows you a different number for the same drive. Stick with one tool for consistent tracking over time rather than jumping between apps and assuming a discrepancy means something is wrong.
Warning Signs That Matter More Than the Percentage

A high health percentage doesn’t guarantee a healthy drive, and a slightly lower one doesn’t mean failure is imminent. These are the actual signals worth acting on:
- Sudden, unexplained drops in health over days rather than months, especially without a corresponding increase in your actual write activity.
- Rising reallocated or pending sector counts, which indicate physical cell failures accumulating.
- Read/write errors or file corruption, particularly files that won’t open, save incorrectly, or trigger checksum errors.
- Unusual slowdowns during large transfers or under sustained load, which can indicate the drive is struggling with failing blocks or thermal throttling.
- The drive disappearing or failing to be recognized intermittently at boot, which often points to a failing controller rather than simple wear.
- Available Spare dropping into warning territory, since this means the drive is running low on healthy blocks to fall back on.
Any one of these is a stronger reason to back up your data immediately than a health percentage sitting anywhere above 90%. If you’re seeing a combination of two or more, treat it as an active warning rather than something to monitor passively.
When Should You Actually Back Up or Replace the Drive?
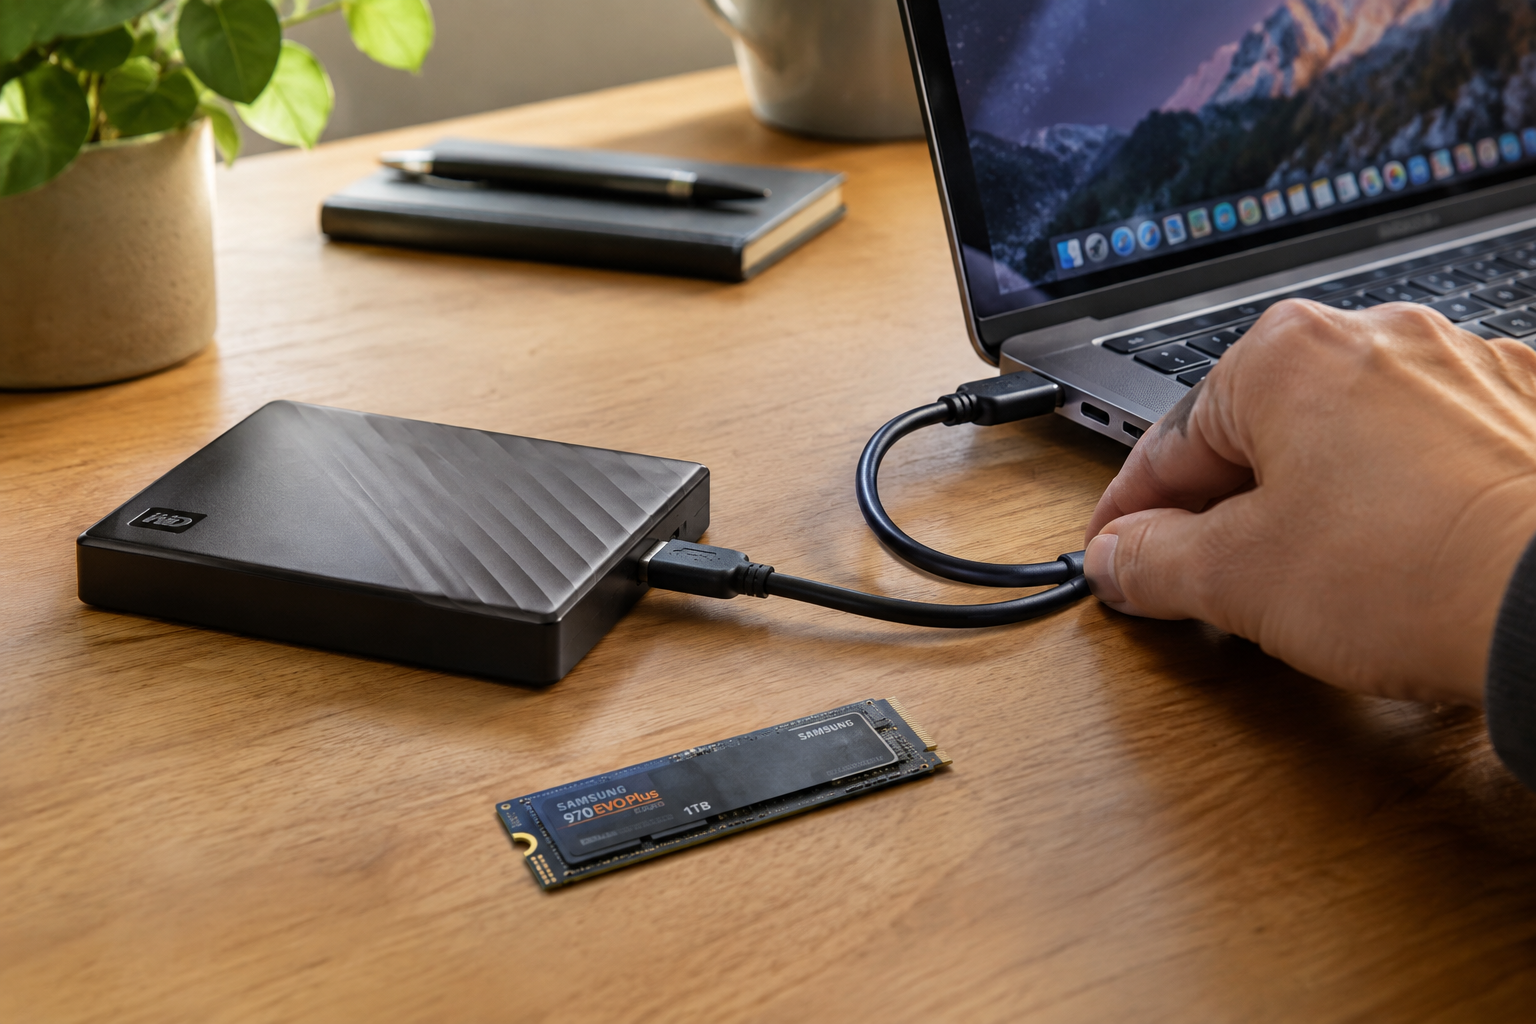
Back up your data continuously regardless of health readings. That’s not a hedge, it’s just good practice, since SSDs can fail suddenly from controller issues that have nothing to do with wear level.
For replacement decisions specifically, use this rough framework:
- Health above 90% with no error flags: No action needed beyond normal backups.
- Health between 70% and 90% with stable trends: Keep monitoring monthly, but there’s no urgency.
- Health below 50%, or Available Spare showing warnings: Start planning a replacement and prioritize backups.
- Any read/write errors, corrupted files, or reallocated sectors climbing: Replace the drive regardless of the health percentage, and back up immediately before doing anything else.
If you’re due for a drive swap anyway, it’s a good time to think about capacity and interface too. If your current setup only has a 512GB drive, our guide on what a 512GB SSD actually means for everyday use can help you decide whether to size up. And if you’re moving from a spinning hard drive as part of this upgrade, the difference in day-to-day performance is covered well in our breakdown of the benefits of upgrading from HDD to SSD.
Whatever drive you replace it with, don’t skip the migration step. Our walkthrough on how to upgrade an SSD without losing data covers cloning your existing setup so you’re not reinstalling your OS and apps from scratch.
Keeping Health Reporting Accurate
A couple of habits keep your health readings meaningful rather than misleading. Keep your SSD’s firmware current, since manufacturers occasionally correct how wear is calculated or reported in firmware updates. Our guide on upgrading Samsung SSD firmware walks through the process if you’re on a Samsung drive specifically.
It’s also worth understanding what’s driving your write volume in the first place. If you’re running an NVMe drive, knowing how it handles sustained workloads compared to a SATA SSD can help you interpret whether wear is coming from normal use or from something like constant swap file activity. Our comparison of NVMe SSDs versus Intel SSD models gets into how different controllers manage this.
Frequently Asked Questions
Does 99% SSD health mean the drive is about to fail?
No. It almost always means you’ve used roughly 1% of the drive’s rated write endurance, which for most consumer SSDs represents a tiny fraction of their total lifespan. Failure risk comes from error patterns and physical wear indicators, not from the health percentage dropping by a point or two.
Why does my SSD health show different percentages in different tools?
Manufacturers calculate health using their own formulas and weighting of SMART or NVMe attributes, so Samsung Magician, CrystalDiskInfo, and a manufacturer’s dashboard tool can all report slightly different numbers from the same drive. Pick one tool and track trends over time rather than comparing absolute numbers across apps.
Can an SSD fail even with high health percentage?
Yes. Controller failures, firmware bugs, and power-related damage can kill a drive suddenly regardless of how much write endurance remains. This is exactly why continuous backups matter more than watching a single health number.
What health percentage should trigger a drive replacement?
As a general guideline, start planning a replacement once health drops below 50% or you see reallocated sectors, media errors, or Available Spare warnings, whichever comes first. Below that threshold, replace the drive immediately rather than waiting for a total failure.

James Kennedy is a writer and product researcher at Drives Hero with a background in IT administration and consulting. He has hands-on experience with storage, networking, and system performance, and regularly improves and optimizes his home networking setup.