SSD Health Percentage vs TBW: What’s the Difference?
You open CrystalDiskInfo or Samsung Magician and see a number staring back at you: 87% health. Maybe it’s 62%. Maybe it’s already down to 15% and you’re wondering if your drive is about to die mid-file-transfer. The problem is that number doesn’t mean what most people think it means, and treating it as a simple countdown to failure can lead you to either panic over a healthy drive or ignore a genuinely failing one.
SSD health percentage and TBW (Terabytes Written) are related, but they’re not the same metric, and neither one tells the whole story on its own. This guide breaks down what each actually measures, which SMART attributes are worth watching, and when a low reading should actually change your behavior.
What TBW Actually Represents

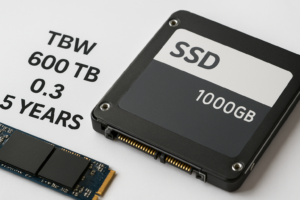
TBW stands for Terabytes Written, and it’s a manufacturer-issued endurance rating tied to a specific drive model. It tells you how much data the manufacturer guarantees you can write to that drive before the warranty no longer covers wear-related failure.
A Samsung 970 EVO Plus 1TB, for example, is rated at 600TBW. A WD Black SN850X 1TB carries a similar rating in that range. These numbers come from lab testing of the NAND flash and controller combination used in that specific model, so a 512GB drive and a 2TB version of the same product line will have very different TBW figures. If you’re comparing drives before a purchase, our breakdown of the WD Black vs Samsung SSD lines shows how endurance ratings shift across capacities and generations.
TBW is not a hard cutoff. Drives routinely exceed their rated TBW and keep working fine, because the rating is conservative by design to protect the manufacturer’s warranty terms. It’s a useful reference point, not a death sentence.
What SSD Health Percentage Actually Means

Health percentage is a calculated value, usually derived by comparing your drive’s actual data written against its TBW rating, alongside other wear indicators like reallocated sectors or spare block consumption. It’s meant to give you a quick, human-readable estimate of remaining lifespan.
The catch is that this calculation isn’t standardized across the industry. Samsung Magician, CrystalDiskInfo, and manufacturer tools like WD Dashboard or Crucial Storage Executive each weigh factors differently, so the same physical drive can show different percentages depending on which software you’re using.
Most of the time, health percentage roughly tracks how much of your TBW allowance you’ve used. If you’ve written 300TB to a drive rated for 600TBW, you’ll typically see something close to 50% health. But it’s an estimate layered on top of an estimate, not a lab measurement of actual NAND wear.
The SMART and NVMe Fields Worth Watching

Instead of fixating on one summary percentage, look at the raw attributes feeding into it. These are the ones that actually matter:
- Percentage Used (NVMe attribute): On NVMe drives, this is reported directly by the controller and is usually the most reliable single number you’ll find. It’s the closest thing to an official health reading.
- Reallocated Sector Count: A rising count here means the drive is retiring bad NAND cells. Occasional small increases are normal over years of use; rapid jumps are not.
- Media Wearout Indicator / Wear Leveling Count: This tracks how evenly write cycles have been spread across NAND cells. A steep decline suggests the flash itself is aging.
- Uncorrectable Error Count: This one matters more than almost anything else. Any nonzero value here deserves attention, since it means data errors couldn’t be fixed by the drive’s own error correction.
- Available Spare (NVMe): SSDs reserve extra NAND blocks to replace failing ones. When this drops below the drive’s threshold (often 10%), it’s a genuine warning sign, not a cosmetic number.
If you’re not sure which of these your drive exposes, CrystalDiskInfo shows both raw SMART data and NVMe-specific fields, and it’s free. It’s a better use of five minutes than trusting a single percentage.
Manufacturer Differences You Should Know About
Not every brand calculates health the same way, and this trips people up constantly when they switch tools or upgrade drives.
Samsung Magician tends to report health based on a proprietary formula that factors in TBW usage plus internal wear leveling data, and it’s generally considered accurate for Samsung’s own drives. WD Dashboard leans more heavily on the NVMe Percentage Used attribute directly from the controller. Crucial’s Storage Executive does something similar for its own lineup.
Third-party tools like CrystalDiskInfo or HD Sentinel apply their own generic formulas when reading SMART data from drives they don’t have manufacturer-specific profiles for. That’s why you might see a Kingston drive reported at 91% in one tool and 85% in another. Neither is necessarily wrong; they’re just weighting the same raw data differently.
If you own an NVMe drive specifically, it’s worth understanding how NVMe reporting differs from older SATA SMART standards in general. Our comparison of NVMe SSD vs Intel SSD touches on some of these controller-level differences if you want more background.
When a Reading Is Normal vs When It’s a Warning Sign
Here’s a realistic way to interpret what you’re seeing, based on how these drives actually fail in practice.
Normal, don’t worry about it
- Health percentage between 90-100% on a drive under two years old with light to moderate use.
- Health slowly declining over years in a way that roughly matches your usage (heavy video editing, constant large file writes, etc).
- A handful of reallocated sectors on a drive that’s several years old, with no growth over recent months.
- Health sitting at 70-80% on a drive that’s exceeded its rated TBW but shows zero uncorrectable errors and stable performance.
Warning signs that justify backing up now
- Any nonzero and growing Uncorrectable Error Count.
- Available Spare dropping below 10% on an NVMe drive.
- Health percentage dropping sharply over a short period (say, 15-20 points in a few weeks) rather than gradually.
- The drive disappearing from the system, taking unusually long to boot, or throwing read/write errors in the operating system.
- Health below 10% combined with any SMART errors, regardless of how the drive is otherwise performing.
If you’re seeing any of the warning signs above, don’t wait for the drive to fail completely before acting. Back up your data immediately and start planning your replacement. Our guide on upgrading an SSD without losing data walks through cloning your current drive so you’re not scrambling when the old one finally gives out.
It’s also worth remembering that health percentage says nothing about physical damage, controller failure, or firmware bugs, which are actually more common causes of sudden SSD death than simple wear-out. A drive can show 95% health and still fail overnight due to a bad firmware update or a power surge. That’s a good argument for keeping backups regardless of what the health meter says, something we cover in more detail in our piece on the benefits of upgrading from HDD to SSD and why storage reliability planning matters either way.
Frequently Asked Questions
Is 80% SSD health still good?
Yes, in most cases. An 80% reading typically means the drive still has years of normal use left, assuming there are no uncorrectable errors or rapid drops in the reading. Pair that percentage with a check of the raw SMART attributes before deciding it means anything urgent.
Does TBW usage actually shorten the life of my files?
Not directly. TBW tracks total data written over the drive’s life, not the age or integrity of files already stored on it. A drive nearing its TBW limit can still read existing data perfectly fine; the concern is more about future write reliability and the increasing likelihood of bad blocks appearing.
Can a drive fail even if health percentage shows 100%?
Yes, and it happens more often than people expect. Health percentage only estimates wear from writes; it doesn’t account for controller failures, firmware bugs, power delivery issues, or manufacturing defects. That’s exactly why relying on backups matters more than watching a single number.

James Kennedy is a writer and product researcher at Drives Hero with a background in IT administration and consulting. He has hands-on experience with storage, networking, and system performance, and regularly improves and optimizes his home networking setup.